
论文专题讲解:GPU Utilization:为什么 100% 不等于训练跑满
这篇文章最值得带回训练系统里的结论是:GPU utilization 更像“GPU 没闲着”的指标,不是“GPU 算力被有效使用”的指标。
Trainy 的案例里,团队已经把 nvidia-smi 里常见的 GPU utilization 推到 100%,功耗也不低,但训练 workload 的 MFU 只有约 20%。继续 profile 后,他们发现 Softmax kernel 虽然让 GPU utilization 很高,但 SM efficiency 很低。经过 fused kernels 和合适的 model parallelism 调整后,训练时间达到 4x 加速,MFU 从约 20% 提到 38%。
关于中文辅助材料。
掘金文章可作为中文阅读辅助,但本站涉及最终数字时以 Trainy 原文为准:原文写的是 MFU 从 20% 提到 38%,不是 58%。这个差异正好提醒我们,性能优化文章一定要保留指标口径和原始来源。
它的效率贡献是什么
| 维度 | 贡献 |
|---|---|
| 节省的成本 | 避免把 100% GPU utilization 误读成训练已经吃满算力,从而把优化停在数据加载、混合精度和基础并行配置之后 |
| 核心机制 | 用 MFU 判断端到端计算效率,用 SM efficiency / SM activity 定位 kernel 是否真正铺满 SM,再用 profiler 找到 memory-bound 或 launch-heavy 层 |
| 对世界模型主线的意义 | 视频 DiT、LLM、VLA 和世界模型训练都容易被 attention、softmax、通信和数据管线卡住;GPU utilization 只能做 idle signal,不能做效率验收 |
| 主要风险 | SM efficiency 也不是最终答案;SM 活跃不代表 Tensor Core、内存带宽、occupancy、NCCL 和端到端 step time 都健康 |
| 应接到本站哪里 | 训练路线图、训练数据系统与吞吐优化、GEMM 与 Attention Kernel、世界模型高效训练技术路线图 |
证据等级与外推边界
这篇文章的证据来自一个 LLM 训练优化项目、PyTorch Profiler 截图、指标定义解释和优化后 MFU/训练时间变化。它能支撑“GPU utilization 会误导训练性能判断”,但不能替代完整 benchmark 或严格消融。
| Claim | Evidence | Evidence level | Can reuse for training systems | Cannot directly infer |
|---|---|---|---|---|
| 100% GPU utilization can still waste compute | 100% utilization with about 20% MFU in the case study | Engineering case | Treat GPU utilization as an idle detector, not a compute-efficiency metric | All 100% utilization jobs are inefficient |
| SM efficiency helps expose underused kernels | PyTorch Profiler shows low SM efficiency during Softmax | Profiler evidence | Add SM activity / SM efficiency to cluster observability and per-layer profiling | High SM efficiency alone means the workload is optimal |
| Fused kernels matter for Transformer training | Softmax, FlashAttention, MLP, dropout-layernorm-residual fusion discussion | System mechanism | Replace memory-bound PyTorch-native layer stacks with fused CUDA/Triton implementations when profiling supports it | Kernel fusion always improves every model or batch shape |
| MFU is a better top-level training efficiency metric | MFU moved from about 20% to 38% after optimization | Case result | Use MFU with tokens/s, step time and peak FLOPs to judge whether more optimization is worth pursuing | MFU can localize the bottleneck by itself |
| Model parallelism must match model and network | Case mentions tuning model-parallel level under 3.2 Tbps InfiniBand | System tuning | Profile communication and compute together instead of only changing batch size | A fixed TP/PP/FSDP layout is best across models and clusters |
最稳的外推方式是把它当成一套诊断顺序:先看 GPU 是否 idle,再看 MFU 是否低,再用 profiler 和 SM / memory / tensor 指标定位具体 kernel 或通信阶段,最后做单项替换并回归训练 loss、吞吐和显存。
文章位置
很多训练优化教程会先列四件事:调大 batch 和 dataloader 参数、打开 fp16/bf16、换 fused optimizer、使用训练型 GPU 和高速网络。这些都重要,但它们只能把训练从“明显喂不饱 GPU”推进到“GPU 一直有活干”。
Trainy 文章提醒的是下一层问题:GPU 一直有活干,不代表这些活是高价值计算。一个 memory-bound softmax、一个很小的 kernel、一个通信等待阶段,或者一串频繁读写 HBM 的算子,都可能让 GPU utilization 很高,但实际 FLOPs 很低。
所以这篇文章在高效训练专题里的位置是“观测指标与排障入口”。Megatron-LM、ZeRO、MagiAttention、Attn-QAT 这些页面讨论的是具体并行、显存、attention 和低比特机制;这篇先回答:你怎么知道自己的训练真的需要这些优化,以及该先优化哪一层。
GPU Utilization 到底测了什么
原文先用 GH100 / H100 的 SM 结构解释为什么 GPU utilization 容易误导。SM 可以理解成 GPU 内调度和执行线程块的基本计算单元;一个 CUDA kernel 只要在某个采样窗口里持续运行,就可能让 GPU utilization 看起来很高,但它未必使用了足够多的 SM,更未必让每个 SM 内部的 Tensor Core 或 CUDA core 高效工作。
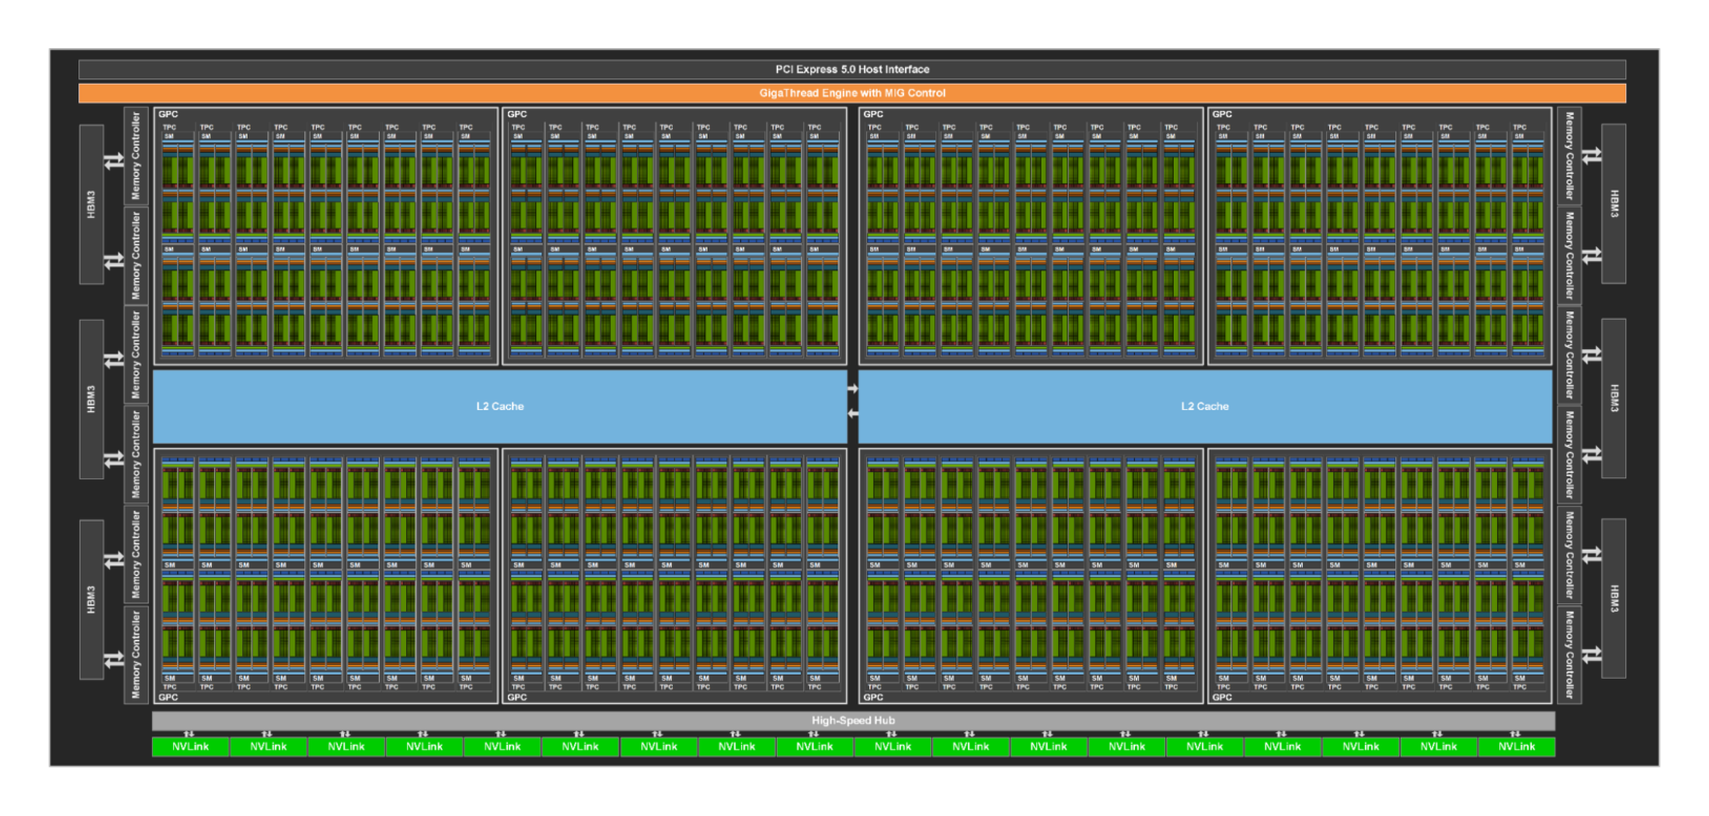
图源:Trainy: GPU Utilization is a Misleading Metric。原图说明:GH100 GPU 中包含大量 Streaming Multiprocessors;原文用它说明 GPU 并行能力来自很多 SM 的协同工作。
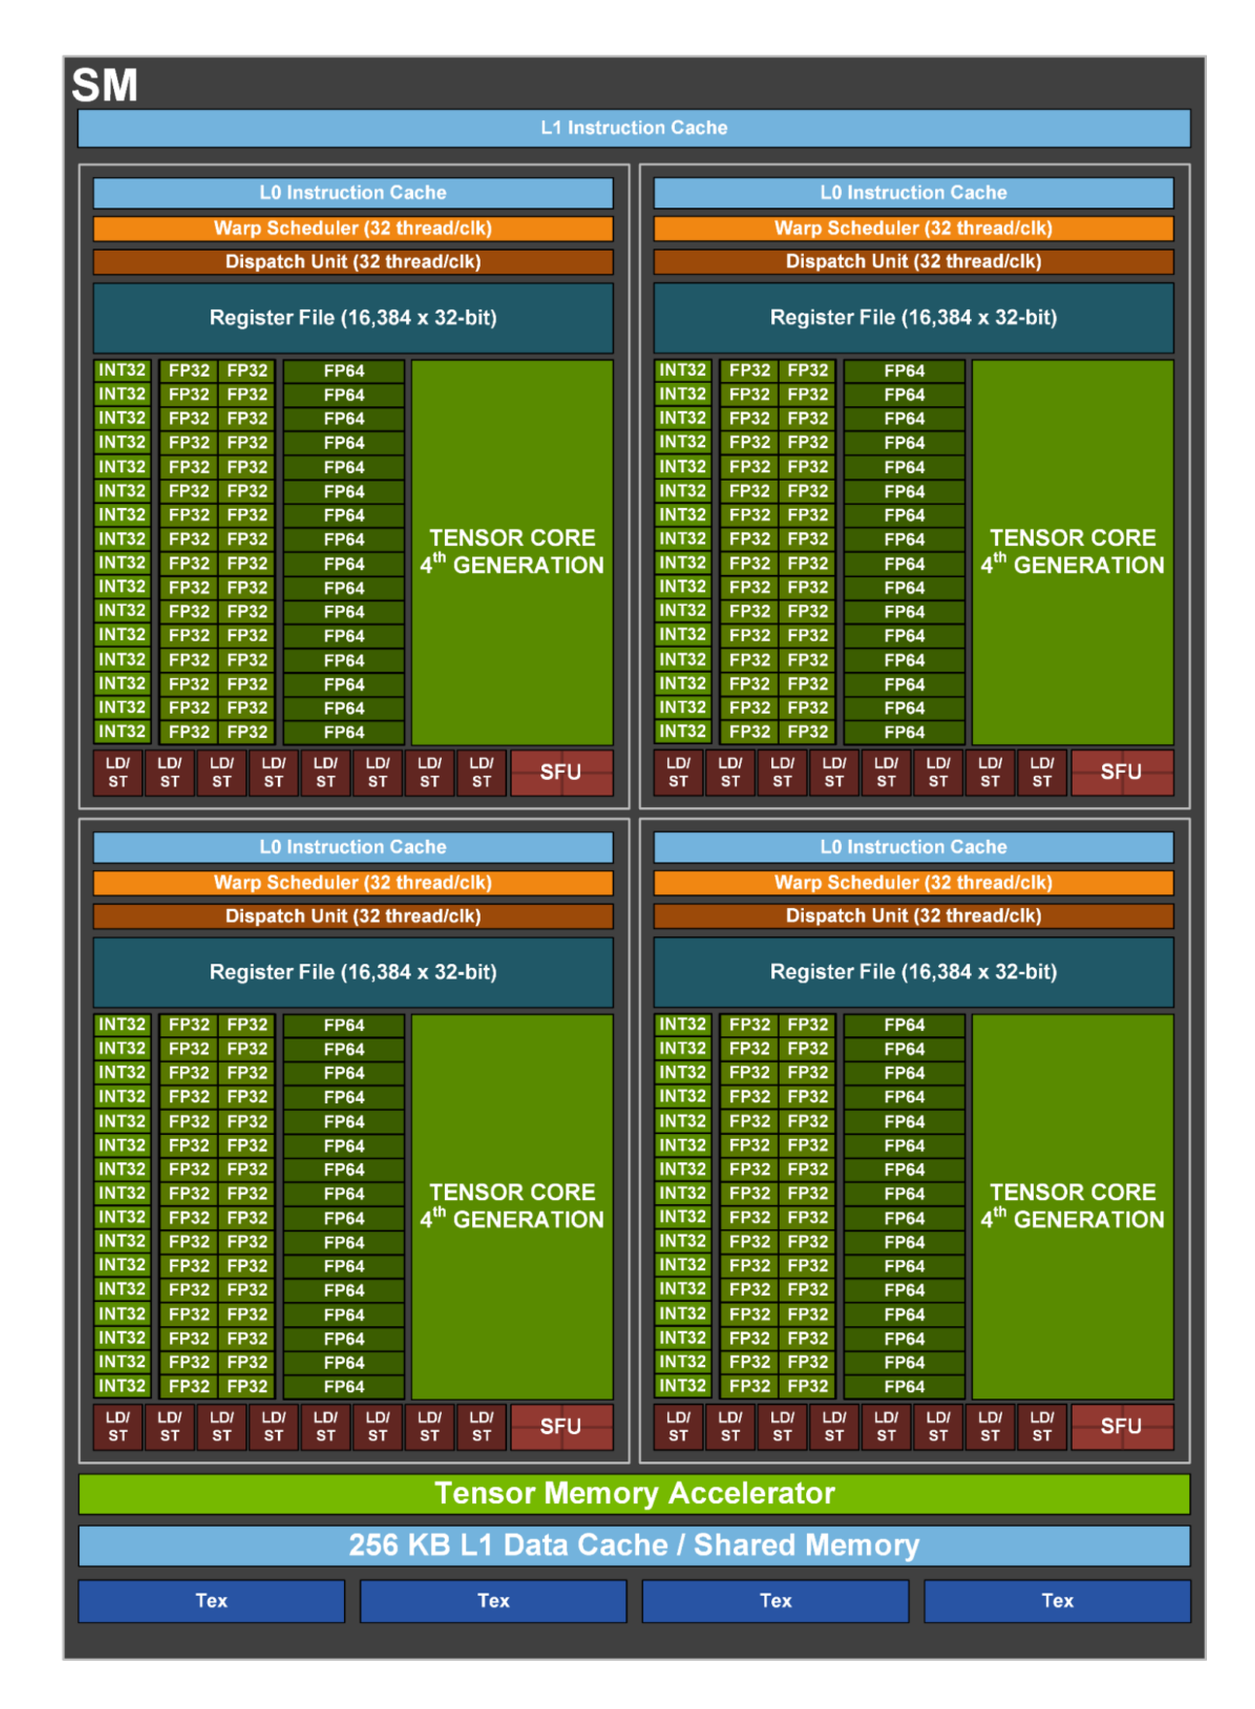
图源:Trainy: GPU Utilization is a Misleading Metric。原图说明:H100 单个 SM 内部包含多个执行单元;原文用它说明“有 kernel 在跑”和“所有计算单元都被有效使用”不是同一件事。
SM 总图和单 SM 图要一起看 utilization 的盲区。
Figure 1 看的是整块 GPU 被拆成多少个 SM;Figure 2 看的是单个 SM 内还有很多执行资源。GPU utilization 的问题在于,它首先回答“有没有 kernel 在跑”,不是回答“多少 SM 在跑、每个 SM 内部多忙、Tensor Core 是否在做矩阵乘”。因此一个只占少量 SM、主要读写内存的 kernel,也可能让 utilization 看起来很好。
原文给了一个很极端但非常有用的思想实验:如果一个 kernel 连续运行 10 秒,但只用到 1 个 SM,那么 nvidia-smi 风格的 GPU utilization 可能显示 100%;可是在 132 SM 的 H100 上,SM efficiency 只有 。这说明 utilization 是必要信号,但不是充分信号。
指标分层
训练排障时更稳的做法,是把指标按粒度分层看。
| Metric | What it measures | Useful for | Blind spot | Typical tool |
|---|---|---|---|---|
| GPU Utilization | Time with at least one running kernel or active GPU work | Detecting idle GPUs and data-loader stalls | Does not reveal SM coverage, arithmetic intensity, Tensor Core use, or memory-bound kernels | nvidia-smi, NVML, dashboards |
| SM Efficiency / SM Activity | Fraction of SMs active over a sampling window | Finding kernels that do not spread work across SMs | Active SMs can still be doing low-value memory work or underfilled warps | PyTorch Profiler, DCGM, Nsight |
| Achieved Occupancy | Active warps per SM relative to hardware capacity | Diagnosing whether each active SM has enough resident work | High occupancy does not guarantee high FLOPs; memory stalls can still dominate | Nsight Compute, PyTorch Profiler |
| Tensor Core / Pipe Utilization | How busy specific execution pipelines are | Checking whether bf16/fp16/fp8 GEMMs are actually using accelerated math units | Does not explain data input or communication stalls by itself | Nsight Compute, DCGM profiling metrics |
| Memory Bandwidth | HBM or memory-interface traffic relative to peak | Identifying memory-bound softmax, norm, copies, cache misses | High bandwidth can be healthy or a symptom depending on arithmetic intensity | Nsight, DCGM, vendor dashboards |
| MFU | Model FLOPs achieved relative to theoretical peak FLOPs | Top-level training efficiency comparison across runs | Requires a model FLOPs estimate and does not localize the slow layer | Training logs plus hardware peak FLOPs |
这里最重要的是别把这些指标排成“谁替代谁”。它们回答的问题不同:
1 | GPU utilization: is the GPU idle? |
GPU utilization 高但 Tensor Core 低
用户最容易遇到的下一层问题是:GPU utilization 已经很高,SM activity 也不低,但 Tensor Core / tensor pipe utilization 仍然偏低。这通常不是“卡坏了”,而是 workload 没有把时间花在 Tensor Core 擅长的 dense matrix multiply / convolution 上。
NVIDIA 的 mixed precision 文档把 Tensor Core 优化拆成三件事:满足 shape 约束、提高 arithmetic intensity、减少 non-Tensor-Core work 的占比。NVIDIA 的矩阵乘性能指南也强调,现代 cuBLAS/cuDNN 即使在部分未对齐 shape 上仍可能使用 Tensor Core,但维度按 16 bytes 或更高粒度对齐时效率更好。PyTorch 侧还要看 AMP/autocast op eligibility、TF32 开关和具体 op eligibility:例如 linear、matmul、mm、bmm、conv 更容易走低精度矩阵路径,而 softmax、layer_norm、sum、log、部分 loss 和 reduction 常会保持或转到 fp32 路径。
| Symptom | Likely reason | How to verify | Typical fix |
|---|---|---|---|
| High GPU Util, low Tensor Core, high memory bandwidth | Memory-bound kernels dominate | Nsight Compute roofline, memory workload analysis, profiler operator table | Fuse memory-bound ops, reduce HBM traffic, use FlashAttention / fused norm / fused optimizer |
| High GPU Util, low Tensor Core, many non-GEMM kernels | Work is softmax, layer norm, activation, embedding, optimizer, scatter/gather, masking, or NCCL | PyTorch Profiler categories, Nsight Systems timeline | Reduce non-Tensor-Core fraction, fuse pointwise/reduction ops, overlap communication |
| Matmul exists, but Tensor Core low | Dtype path is not eligible: fp32 with TF32 disabled, AMP disabled, explicit dtype=, in-place or out= ops bypass autocast |
Check PyTorch autocast regions, torch.set_float32_matmul_precision, TF32 flags, kernel metrics |
Enable bf16/fp16 AMP where stable, enable TF32 for fp32 matmul when acceptable, avoid autocast-breaking calls |
| Tensor Core kernels appear, but utilization low | GEMM shapes are too small, fragmented, or poorly aligned | Inspect M/N/K, batch size, sequence packing, head dimension, tile count | Increase micro-batch, pad dimensions, pack sequences, choose hidden/head sizes aligned with Tensor Core-friendly multiples |
| Tensor Core active only in short bursts | Kernel launch overhead or many tiny kernels dominate | Nsight Systems launch timeline, CPU overhead, graph breaks | Use fused modules, CUDA Graphs where applicable, torch.compile only after validating graph breaks |
| Good Tensor Core in forward, low step-level Tensor Core | Backward, optimizer, communication, checkpoint recompute or dataloader consumes wall time | Step breakdown: forward/backward/optimizer/NCCL/dataloader | Fused optimizer, communication overlap, better FSDP/TP buckets, input pipeline fixes |
| Tensor Core low in MoE / sparse / retrieval-heavy model | Routing, top-k, all-to-all, unstructured sparsity and gather/scatter dominate | Per-layer trace and NCCL timeline | Batch/routing coalescing, expert capacity tuning, structured sparsity or dense fallback for hot paths |
这个现象和 Trainy 文章里的 Softmax 案例是同一个家族:GPU 一直忙,但忙的是内存读写、reduction、通信或小 kernel,而不是大块 dense GEMM。Tensor Core 低时,优先问四个问题:
- 当前 step 的 wall time 里,dense GEMM/conv 到底占多少?
- 这些 GEMM/conv 的 dtype、shape、layout 是否能走 Tensor Core 高效路径?
- 非 Tensor Core work 是否被 softmax、norm、optimizer、mask、embedding、NCCL 或 dataloader 放大?
- 即使 Tensor Core kernel 很快,端到端 step time 是否被通信、checkpointing 或 Python/launch overhead 吃掉?
诊断口径。
不要只看一个 tensor_core_utilization 面板。更稳的方式是同时看 Nsight Systems 的时间线、Nsight Compute roofline 里的 tensor pipe / memory / roofline、PyTorch Profiler 的 op 表,以及训练日志里的 MFU。若 roofline 显示 kernel 被 memory ceiling 限制,Tensor Core 低是结果,不是根因;若 GEMM shape 很小或未对齐,Tensor Core 低才可能是直接优化点。
MFU 的训练口径
MFU 来自 PaLM 等大模型训练报告中常用的口径。对 dense Transformer,粗略上可以写成:
如果是图像、视频或世界模型训练,也可以把分子改成每 step 估算的训练 FLOPs 除以 step time:
这个公式有三个容易踩坑的地方:
model FLOPs要和模型结构一致。MoE 要按 activated experts 和实际路由算,不能简单用 total parameters;长上下文 attention 还要补 或对应 fused attention 的等价 FLOPs。peak FLOPs要和实际精度一致。bf16/fp16/fp8/fp4 的理论峰值不同,Tensor Core 是否被用上也会影响解释。tokens/s或samples/s要在 warmup 后稳态测。包含 checkpoint、eval、数据缓存未命中和编译 warmup 的窗口会污染 MFU。
所以 MFU 很适合做“还有没有大优化空间”的判断。比如 20% MFU 通常说明值得继续 profile;40% 到 50% 之后,再提升十个百分点可能就需要更深的 kernel、通信和并行布局改造。
Softmax 为什么会暴露问题
Trainy 的案例中,PyTorch Profiler 显示 Softmax kernel 的 GPU utilization 很高,但 SM efficiency 很低。
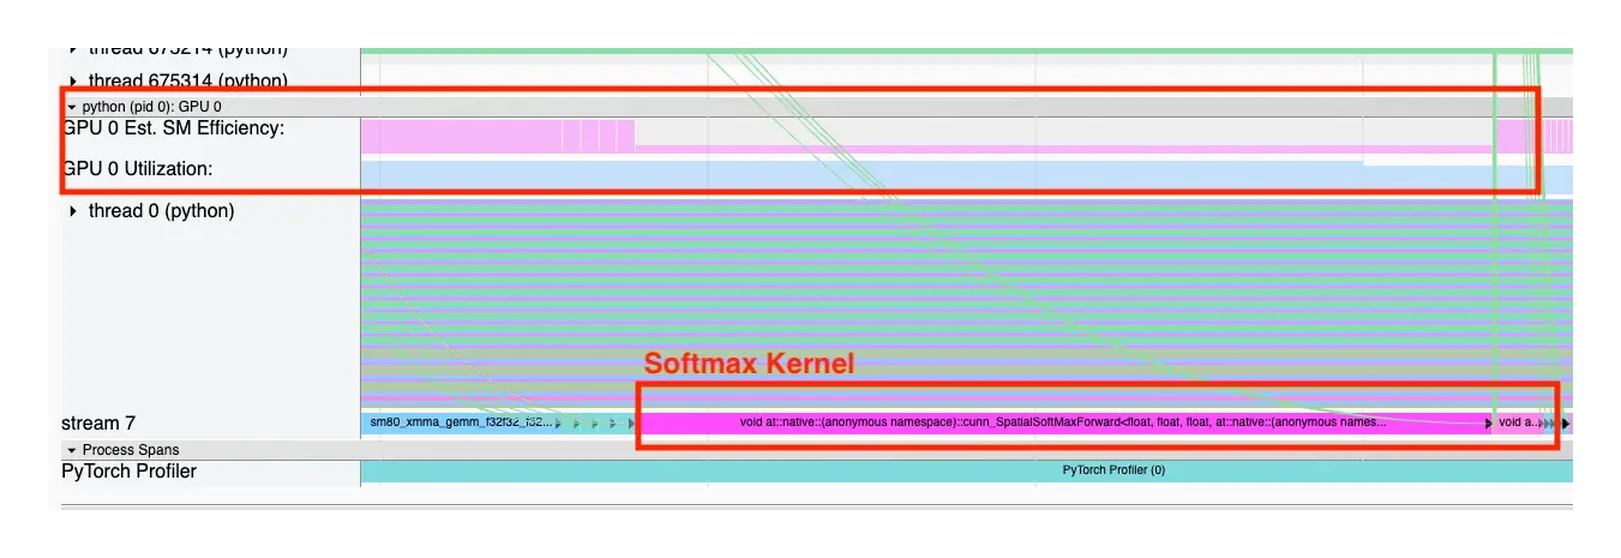
图源:Trainy: GPU Utilization is a Misleading Metric。原图说明:PyTorch Profiler 中 Softmax kernel 显示低 SM Efficiency;原文用它说明 GPU utilization 高并不等于 kernel 高效。
这张 profiler 图怎么读。
先看时间轴里是哪类算子占据训练循环,再看同一段里的 GPU utilization、SM efficiency 和算子名称是否一致。这里的重点不是“Softmax 永远不好”,而是 naive softmax 常常读写多、算术强度低、shape 又可能不够饱满;它可以让 GPU 忙着搬数据,却没有把大量时间花在 Tensor Core GEMM 这类高 FLOPs 计算上。
Transformer block 里 attention softmax 特别容易成为指标陷阱:
| Workload pattern | Why GPU Utilization can look good | Why MFU / SM metrics may stay low | Typical fix |
|---|---|---|---|
| Naive Softmax | A kernel runs continuously and touches memory | Low arithmetic intensity, repeated HBM traffic, poor fusion | Fused softmax, FlashAttention / SDPA |
| Small elementwise ops | Many kernels keep launching | Launch overhead and fragmented memory reads dominate | Fuse dropout, bias, residual, layer norm |
| Tiny micro-batches | GPU always has some work | GEMMs are too small to saturate Tensor Cores | Larger micro-batch, gradient accumulation, better sequence packing |
| Communication-heavy step | NCCL or synchronization keeps devices active | Compute units wait around collectives or imbalance | Tune TP/PP/DP/FSDP, overlap communication, fix stragglers |
| Input pipeline almost-but-not-quite stable | GPU rarely fully idle | Short bubbles between batches reduce steady-state throughput | Prefetch, pin memory, CPU/GPU preprocessing split |
这张表也说明,GPU utilization 不是没用。它能告诉你机器有没有明显空闲,但它不能告诉你“忙的内容是否值钱”。
优化路径:从替换指标到替换 kernel
原文最终把优化落到 Transformer block 内的 kernel fusion。
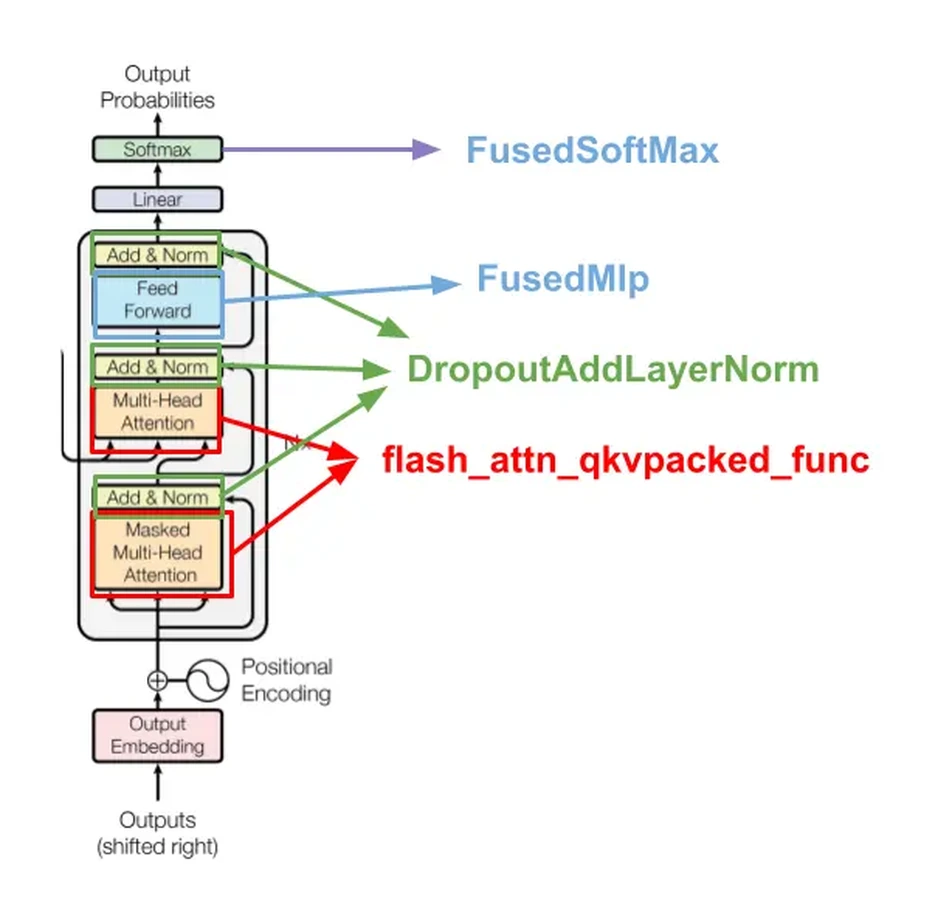
图源:Trainy: GPU Utilization is a Misleading Metric。原图说明:Transformer block 中可以通过 fused attention / fused MLP / fused dropout-layernorm-residual 等减少内存读写和 kernel launch 开销。
这张 kernel fusion 图怎么读。
图里的重点不是“所有层都要手写 CUDA”,而是把多个 PyTorch 原生小算子替换成更少、更贴近硬件的数据流。FlashAttention 是典型例子:它不只是把 softmax 写快,而是避免把完整 attention matrix 反复写入 HBM。MLP、dropout、layer norm、residual add 的融合也类似,目标是减少读写、减少 launch,并让 shape 更容易喂饱 GPU。
训练优化可以按下面顺序做,避免一上来就改复杂分布式结构:
- 先确认不是输入饿死 GPU:记录 dataloader wait time、CPU preprocessing、storage bandwidth、batch ready time。常见调参是
num_workers、pin_memory、prefetch_factor、persistent workers、数据缓存和 GPU-side preprocessing。 - 再确认数值路径对:bf16/fp16 是否真的启用 Tensor Core;是否有意外 fp32 fallback;loss scale、grad scaler 和 autocast 范围是否合理。
- 再算 MFU:如果 GPU utilization 高但 MFU 低,说明训练还没把理论峰值转成有效模型 FLOPs。
- 用 profiler 找层级瓶颈:按 step time 排序,看 attention、MLP、norm、optimizer、all-reduce、all-gather、activation checkpoint recompute、dataloader 哪些占比异常。
- 按证据替换 fused implementation:优先替换 profiler 指出的 memory-bound 或 launch-heavy 算子,例如 FlashAttention / SDPA、fused MLP、fused bias-dropout-add-layernorm、fused optimizer。
- 重新选并行切分:TP、PP、DP、FSDP、ZeRO、sequence/context parallelism 都会改变通信/计算比。模型小却过度切分,通信会盖过计算;模型大但切分不足,又会 OOM 或 micro-batch 太小。
- 回归质量和稳定性:吞吐提升后要同时看 loss curve、grad norm、溢出、checkpoint 可恢复性和验证集指标。训练系统优化不能只看 tokens/s。
这里的训练细节尤其适合和 Megatron-LM、ZeRO、MagiAttention 一起读:Megatron-LM 解释 tensor parallel 为什么能把大 GEMM 切开;ZeRO 解释参数、梯度和优化器状态为什么要分片;MagiAttention 解释长上下文 attention 为什么还要按 mask area 和通信路径调度。Trainy 这篇则提醒你:这些复杂技术要由指标和 profiler 触发,而不是凭感觉堆上去。
对 LLM / 世界模型训练的具体启发
LLM 预训练
LLM 训练中,最常见的误判是“GPU utilization 100%,所以吞吐慢只能加卡”。实际可能是:
| Symptom | Likely bottleneck | Training detail to inspect |
|---|---|---|
| 100% GPU Utilization, low MFU | Memory-bound kernels or tiny GEMMs | Attention implementation, sequence length, micro-batch, tensor shapes |
| High SM Activity, low Tensor Core use | Non-GEMM kernels dominate | Softmax, layer norm, embedding, optimizer, fp32 fallback |
| Good single-GPU step, poor multi-GPU scaling | Communication or sharding imbalance | NCCL timeline, TP all-reduce, FSDP all-gather, gradient bucket sizes |
| High throughput but unstable loss | Numerical or optimizer issue | bf16/fp16 range, fused optimizer behavior, gradient clipping, loss scaling |
| Profiler dominated by dataloader | Input pipeline | Token packing, mmap/cache, CPU preprocessing, prefetch and worker count |
这也是为什么训练日志里不应该只写 gpu_util。更稳的最小日志集包括:
1 | global_step |
视频 DiT 和世界模型
视频生成和世界模型训练更容易被 GPU utilization 误导,因为它们同时有长序列 attention、VAE/tokenizer、视频解码、数据增强、条件编码器、跨帧 mask、分布式通信和 rollout 评测。
如果只看 GPU utilization,你很难区分下面几种情况:
| World-model case | Looks like | Real question |
|---|---|---|
| Long video attention | GPU is busy | Is attention compute-bound, memory-bound, or communication-bound? |
| Action-conditioned rollout | GPU is busy | Is decode dominated by denoising steps, KV cache, or action adapter? |
| Multi-camera batch | GPU is busy | Are camera streams packed efficiently or padded into wasted tokens? |
| Synthetic data generation | GPU is busy | Are generated samples accepted by checker, or just burning rollout compute? |
| Closed-loop evaluation | GPU is busy | Is simulator / environment step blocking model compute? |
对世界模型高效训练来说,真正应该验收的是“每 GPU-hour 产生多少有效训练信号”。这比 GPU utilization 更接近工程目标:
1 | accepted_tokens_or_frames_per_gpu_hour |
换句话说,GPU 忙不忙只是第一层;它忙出来的 token、帧、rollout 和 hard cases 是否进入有效训练,才是高效训练的最终账。
一个可复用排障流程
把 Trainy 的经验压缩成工程流程,可以这样跑:
1 | 1. Warm up training for enough steps |
这套流程的关键是单变量迭代。不要同时改 batch、precision、FlashAttention、FSDP bucket、activation checkpointing 和数据加载,否则吞吐涨了也很难知道原因,loss 波动时更难回滚。
局限和风险
这篇文章有几个边界要保留:
- 它是工程案例,不是公开可复现实验。
4x加速和20% -> 38% MFU不能直接套到所有模型。 - SM efficiency 比 GPU utilization 更细,但不是最终指标。高 SM activity 仍可能因为内存、warp divergence、低 Tensor Core use 或通信等待而低效。
- MFU 依赖 FLOPs 估算。MoE、稀疏 attention、activation checkpointing、重计算和多模态 encoder 都会让估算变复杂。
- Fused kernel 可能改变数值路径、autograd 图、checkpoint 兼容性和调试难度。尤其在 FSDP、ZeRO、sequence parallel 和
torch.compile混用时,要用小规模回归先验证。 - 训练效率不是唯一目标。对世界模型和 VLA 来说,action sensitivity、风险校准、长时一致性和闭环成功率必须和吞吐一起验收。
阅读结论
这篇文章最值得记住的是一个诊断顺序:GPU utilization 只能说明 GPU 大概率没闲着,不能说明算力被高价值使用。训练效率要先看 MFU,再用 SM activity、Tensor Core / memory / NCCL 指标和 profiler timeline 找瓶颈,最后才决定要不要上 fused kernel、改 batch packing、调并行切分或优化数据管线。
对 LLM、视频 DiT、VLA 和世界模型训练来说,真正的效率指标应该是“每 GPU-hour 产生多少有效训练信号”。如果 GPU 很忙,但忙出来的是无效 padding、低质量 rollout、未通过 verifier 的合成数据或不能改善闭环指标的样本,那仍然不是高效训练。
外部精读
- Trainy: GPU Utilization is a Misleading Metric:原文;重点读 GPU utilization、SM efficiency、MFU 和 Softmax 案例。
- NVIDIA Mixed Precision Training Guide:理解 Tensor Core 路径、shape 和 arithmetic intensity。
- NVIDIA Matrix Multiplication Background User’s Guide:看 GEMM shape、tile 和 Tensor Core 性能约束。
- Nsight Compute Roofline:区分 compute-bound、memory-bound 和 roofline 诊断。
- Title: 论文专题讲解:GPU Utilization:为什么 100% 不等于训练跑满
- Author: Charles
- Created at : 2026-05-25 09:00:00
- Updated at : 2026-05-25 09:00:00
- Link: https://charles2530.github.io/2026/05/25/ai-files-paper-deep-dives-foundations-gpu-utilization-misleading/
- License: This work is licensed under CC BY-NC-SA 4.0.